Digital Twins in Manufacturing: The Complete Guide for Industrial Plants
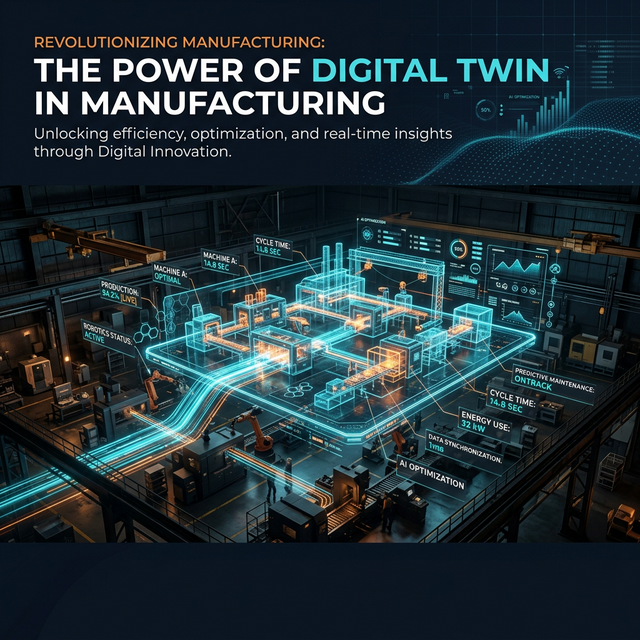
Everything you need to know about Digital Twins in manufacturing: what they are, how they work, how they differ from SCADA and MES, and how to implement one without investing in IoT.
Digital Twins in Manufacturing: The Complete Guide for Industrial Plants
Imagine being able to see your entire plant — every machine, every part in process, every operator — on one screen, in real time, without walking to the floor. Not security camera footage. A living model that tells you what each machine is producing, how many parts it has made, how much WIP is queued, where the bottleneck is, and whether you will make Friday's delivery.
That is a Digital Twin. And far from being science fiction or a luxury for German automakers, it is now an accessible tool for any discrete manufacturing plant.
This guide covers everything a production engineer, plant manager or operations director needs to know: from the concept to practical implementation, without the fluff.
What Is an Industrial Digital Twin?
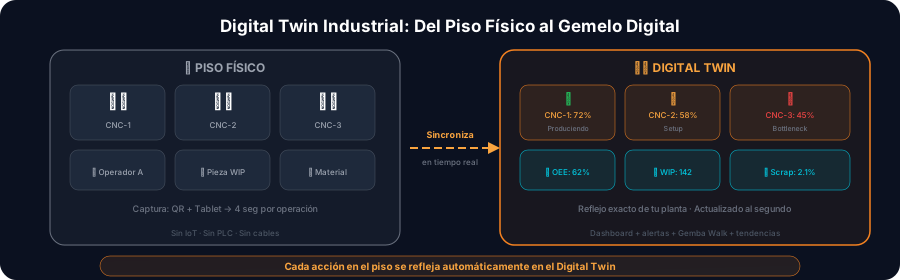
A Digital Twin is a real-time digital representation of a physical system. In manufacturing, it is a virtual model of your plant reflecting the current state of machines, production flows and materials.
But here is the key point many technology vendors leave out: a useful Digital Twin is not a pretty 3D render. It is a model of operational data that lets you make decisions without walking to the floor.
The 3 Levels of Digital Twin
Not all Digital Twins are alike. The industry classifies them into three maturity levels:
Level 1: Digital Mirror
- Shows the current state of the physical system
- It is informational: you see what is happening, but not why
- Example: a dashboard showing whether each machine is running or stopped
Level 2: Analytical Twin
- Beyond showing state, it computes derived metrics
- It detects patterns, bottlenecks and anomalies
- Example: a system showing real-time OEE, WIP accumulated per workstation, and alerts when a machine deviates from its normal cycle time
Level 3: Predictive Twin
- Uses mathematical models or AI to predict future behavior
- Simulates "what-if" scenarios before they happen
- Example: "If CNC-3 fails in 2 hours, how many parts do we lose and which orders slip?"
Most plants benefit enormously from just reaching Level 2. The jump from no visibility to an analytical twin is transformative.
If you want to understand the concept from scratch, read our introductory article: What Is an Industrial Digital Twin?
Why Does a Plant Need a Digital Twin?
The Problem: The Invisible Plant
Ask any plant manager these three questions at 3 PM on a Tuesday:
- How many parts has CNC-7 made today?
- How much WIP sits between cutting and welding?
- Are we going to make order #4521 by Friday?
If the answer is "let me ask the supervisor" or "let me check the spreadsheet", that plant operates blind. And operating blind has real costs:
- Late deliveries because nobody saw the bottleneck form at 10 AM
- Overproduction because orders were released without knowing real available capacity
- Slow reaction time — problems get discovered hours or days after they happened
- Decisions by intuition instead of data — "I think the milling machine is the problem"
The Solution: Real-Time Operational Visibility
A Digital Twin eliminates operational blindness. When you open the screen you see:
- Every machine with its current state (running, setup, stopped, maintenance)
- Every part in process (WIP) with its location, queue time and current workstation
- Live metrics: OEE, throughput, cycle time vs takt time, bottlenecks
- Proactive alerts when something goes out of range, before it hits the delivery
This doesn't replace the supervisor — it strengthens them. It gives them data to make in seconds decisions that used to take hours.
The Architecture of a Manufacturing Digital Twin
Layer 1: Data Ingestion
Every Digital Twin starts with data from the physical world. The key question is: how does that data get in?
There are three main sources:
| Source | Method | Investment | Granularity |
|---|---|---|---|
| IoT sensors / PLC | Direct machine signals (OPC-UA, MQTT) | High ($5K-$50K per machine) | Per second |
| ERP/MES integration | APIs or batch files | Medium | Per transaction |
| Digital human capture | QR codes, tablets, scanners | Low ($200-$500 per workstation) | Per event |
The first option is what the big integrators sell. The third is what works for 90% of industrial SMBs. Read more about that approach in Implementing a Digital Twin Without IoT.
Layer 2: The Data Model (State Engine)
Raw data isn't useful. You need a state engine that understands your plant's semantics:
- Entities: machine, WIP (part in process), order, operator, material
- States: idle, setup, running, stopped, maintenance
- Relationships: WIP is on Machine-3, Machine-3 belongs to Line-A, Order-4521 has 45 WIPs
That model is what turns a plain "the machine is running" into "the machine is producing part #347 of order #4521, it is 1.8 min into a 2.0 min standard cycle, and it has 12 parts queued".
Layer 3: Visualization (Presentation Layer)
The layer the user sees. There are two paradigms:
Traditional dashboard: charts, tables, KPIs. Useful for managers reviewing reports.
Spatial Digital Twin: a representation of the plant layout with machines positioned as they are on the real floor. Each machine is a card showing its state, current part, OEE and alerts.
The Patok Digital Twin uses the second paradigm — you lay out the machine cards as they sit in your plant and see the production flow as if you were standing on the floor, but with data superpowers.
Layer 4: Intelligence (Analytics & Alerts)
The layer that turns data into action:
- Anomaly detection: an unusually high cycle time → alert the supervisor
- Bottleneck scoring: automatic identification of the current constraint
- Delivery forecast: at the current rate, will you hit the due date?
- Variability: Kingman's equation computes expected waiting times based on process variability
Digital Twin vs SCADA vs MES: Which Do You Need?
This is one of the most frequent questions we get from plant engineers. The short answer: they are not the same, and they are not mutually exclusive.
We have a full article dedicated to this comparison: Digital Twin vs SCADA vs MES. Here is the executive summary:
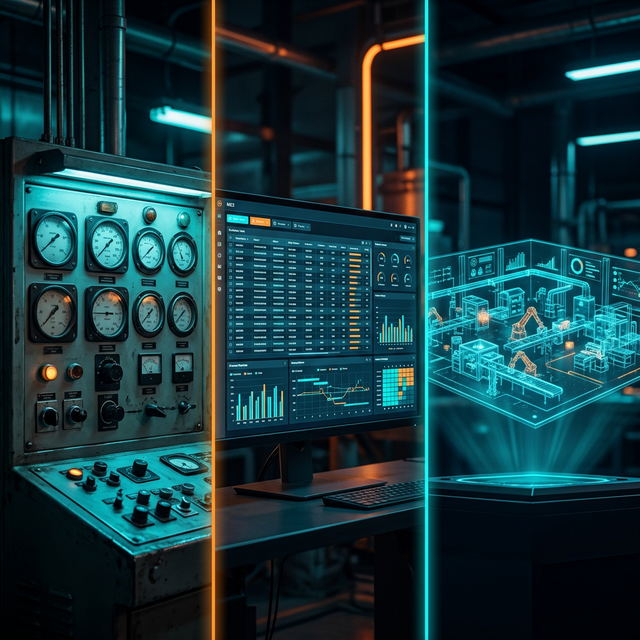
| Aspect | SCADA | MES | Digital Twin |
|---|---|---|---|
| Focus | Machine control | Order execution | Operational visibility |
| Granularity | Signals/variables | Transactions | The complete system state |
| User | Automation engineer | Planning/production | Everyone (operator to director) |
| Typical investment | $50K-$500K | $100K-$1M+ | $5K-$50K |
| Implementation time | 3-12 months | 6-24 months | 1-4 weeks |
For industrial SMBs with neither SCADA nor MES, a Digital Twin is the most practical entry point. You get real operational visibility at a fraction of the cost and time.
Real Use Cases
1. Multi-Shift Plant Monitoring
The problem: the manager only has visibility of the morning shift, when they are present. On the night shift, they don't know what happens until the reports arrive the next day.
With a Digital Twin: they open the app from home at 11 PM and see exactly what each machine is producing, whether there are stoppages, and whether the shift is on pace. Alerts notify them in real time if something critical happens.
Impact: 35% reduction in reaction time to night-shift problems.
2. WIP and Bottleneck Control
The problem: the plant has 200+ parts in process simultaneously. Nobody knows exactly where each part is or how long it has been queued.
With a Digital Twin: every WIP has a QR code. Scan it, and the system knows which machine it is on, how long it has been there, and what is left. The plant map shows where WIP accumulates — a direct signal of the bottleneck.
Impact: lead time cut from 5 days to 3.2 days by making stalled WIP visible.
3. Visual Management for Operators
The problem: operators have no context on how urgent parts are, or on how their workstation is performing.
With a Digital Twin: an industrial kiosk with a tablet at each workstation shows the operator their work queue, the current part, the target cycle time and their partial OEE for the shift. That creates an instant feedback loop.
Impact: 15% improvement in adherence to standard cycle time.
4. Data-Driven Production Meetings
The problem: the daily production meeting runs on yesterday's reports, hand-edited, with data that is no longer relevant.
With a Digital Twin: the meeting opens the Digital Twin on the big screen. Live KPIs get reviewed: OEE per machine, orders at risk, current bottlenecks. Decisions get made on data from this moment, not from yesterday.
Impact: production meeting cut from 45 min to 15 min, with better decisions.
Practical Implementation: From Zero to Digital Twin
Phase 1: Model Your Plant (Days 1-2)
Define your plant's digital structure:
- Floors / areas: the general layout
- Machines: name, type, position (start/middle/end of line), capacity
- Products: the product list with their process routings
- Flows: which machines process each product, and in what sequence
With Patok Gemba, this happens in a visual interface where you drag machine cards to represent your real layout.
Phase 2: Connect the Floor (Days 3-5)
Install the data capture points:
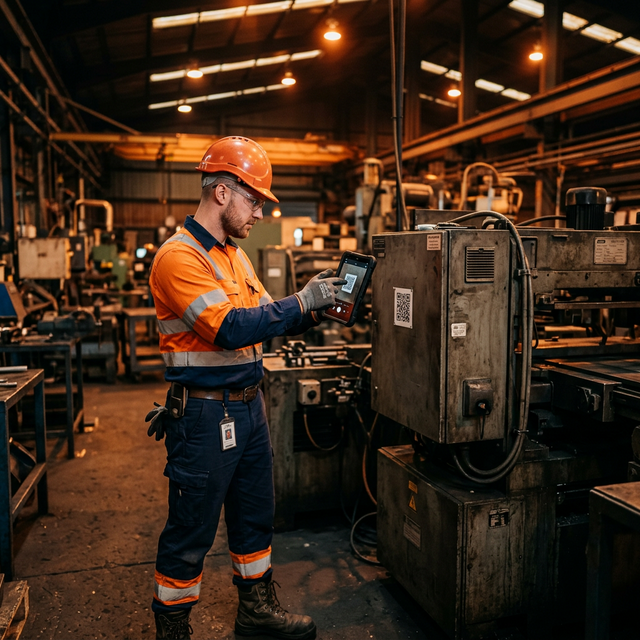
- A QR code on every machine: the operator scans to start and end operations
- A tablet or kiosk: for operators who need a fixed interface
- A handheld scanner: for supervisors walking the floor (digital Gemba Walk)
You don't need IoT sensors. You don't need PLC integration. You don't need industrial WiFi. A smartphone with a camera and an internet connection is enough to start.
Phase 3: Calibrate (Week 2)
The first 5-7 days of data will reveal:
- Real cycle times versus what you believed
- Setup times nobody was measuring
- Stoppages nobody was logging
- A real OEE probably 15-20 points below what you expected
Don't be alarmed. That is exactly the value — now you see it and can improve it.
Phase 4: Act (Week 3 and Beyond)
With real data, you can:
- Identify the main bottleneck and attack it
- Standardize setup times with evidence
- Balance loads between shifts
- Promise delivery dates based on data, not intuition
The Cost of NOT Having a Digital Twin
Many directors ask "how much does it cost to implement a Digital Twin?" The right question is: how much is not having one costing you?
The Hidden Costs of Operating Blind
| Hidden cost | Typical impact |
|---|---|
| Late deliveries → penalties or lost customers | 2-5% of annual sales |
| Overproduction → dead inventory | 10-15% of capital tied up in WIP |
| Slow reaction → problems that escalate | 3-8 machine hours lost per week |
| Decisions by intuition → sub-optimization | OEE 15-20 points below what is possible |
| Inefficient meetings → wasted person-hours | 5-10 management hours/week |
A Digital Twin is not an expense — it is the removal of invisible costs you are already paying.
Enabling Technologies
Real-Time Streaming
An effective Digital Twin needs real-time data, not batch reports. Streaming technology lets changes on the production floor appear in the digital model in under a second.
Which means that when an operator finishes a part and scans the QR code, everyone watching the Digital Twin — the supervisor on the floor, the manager in the office, the director in another city — sees the change instantly.
Knowledge Graph
The relationships between entities (machine → WIP → order → customer) form a knowledge graph that makes complex questions answerable:
- "How many parts from customer X's order are at the quality station?"
- "Which orders are affected if CNC-3 goes into maintenance?"
- "What route did part #1234 actually take from raw material?"
That traceability is impossible with spreadsheets and difficult with conventional ERPs.
Little's Law in Real Time
Little's Law (WIP = Throughput × Lead Time) comes alive in a Digital Twin. You can see in real time how WIP accumulating at one workstation lengthens the lead time of the whole plant.
That turns an academic formula into a decision tool: "if we cut WIP at the paint station from 30 to 15 parts, our lead time drops from 4 days to 2.5".
Digital Twin and Lean Manufacturing
A Digital Twin doesn't compete with Lean Manufacturing — it strengthens it. Every Lean principle benefits from real-time data:
Muda (Waste)
The 7 wastes become visible:
- Waiting: the Digital Twin shows how long each WIP spends queued
- Overproduction: alerts when more parts get made than ordered
- Inventory: total WIP visible in real time, not just at month-end
- Transport: location tracking reveals unnecessary movement
Digital Gemba Walk
The idea of "going to the gemba" extends with a Digital Twin. Patok's digital Gemba Walk combines the physical walk with contextual data: as you move through the plant with a handheld, you see each machine's data by scanning its QR code.
Kanban and Pull Systems
A Digital Twin with integrated digital Kanban turns the pull system from theory into practice. Kanban signals fire automatically based on real consumption, not a board of sticky notes nobody updates.
Digital Twin Myths
"I need IoT and sensors on every machine"
False. Read our full article on implementing a Digital Twin without IoT. Data capture with QR codes and tablets delivers 90% of the benefits at 10% of the cost.
"It's only for large companies"
False. Large companies use Siemens MindSphere or PTC ThingWorx ($200K+ solutions). But the Digital Twin concept scales down. A 10-machine plant can have a working Digital Twin in a week.
"It's the same as SCADA"
False. SCADA controls machines. A Digital Twin models flows. They are complementary, not substitutes. See the full comparison in Digital Twin vs SCADA vs MES.
"My operators won't use it"
Probably true if you do it badly. A Digital Twin that asks operators to fill in complex forms will fail. One that only asks for a QR scan (2 seconds) gets 95%+ adoption.
"I need historical data before starting"
False. The Digital Twin starts generating data from day one. You don't need 6 months of history to get value — real-time visibility pays immediately.
How to Choose a Digital Twin Solution
Evaluation Criteria
| Criterion | Key questions |
|---|---|
| Implementation time | Can I be operational in under 2 weeks? |
| Hardware required | Do I have to install sensors, PLCs, gateways? |
| Ease of use for operators | Is it an app a high-school-educated operator can use? |
| Total cost | What is the monthly cost per machine/workstation? |
| Scalability | Can I start with 5 machines and scale to 50? |
| Real-time data | Is the data live, or batched? |
| Computed metrics | Does it calculate OEE, cycle time and lead time automatically? |
| Local support | Does the team understand manufacturing in my region? |
Why Patok
Patok was designed specifically for discrete manufacturing plants in Latin America:
- Implementation in days, not months: no complex integrations
- No IoT: QR codes + tablets = immediate data capture
- Industrial design: touch-first interface, readable with gloves, optimized for the shop floor
- Automatic metrics: OEE, cycle time, lead time, bottleneck score — all computed without intervention
- Real-time streaming: data appears in the Digital Twin in under a second
- Built for the floor: designed around how manufacturing operators actually work
Conclusion: The Digital Twin Is Not the Future — It Is the Present
Ten years ago, a manufacturing Digital Twin was a $500K+ project only Siemens could deliver. Today, with mobile devices, cloud computing and platforms like Patok converging, any plant can have real-time operational visibility for a fraction of that.
The question is no longer "should I invest in a Digital Twin?" but "how much longer am I going to operate blind before deciding?"
Every day without visibility is a day of deliveries at risk, invisible bottlenecks and decisions by intuition. And the cost of that blindness, as we saw, is far greater than the cost of the solution.
Your next step: pick your most troublesome production line. Model it digitally. Give it 2 weeks of data. The results will convince you more than any article.
Ready to see your plant like never before? Book a free diagnostic Gemba Walk — in an hour we map your most critical line and show you how it looks in a Digital Twin.
Topics
Related Articles
More on Digital Twin
Ready to transform your plant?
Book a free adoption session and find your biggest opportunity to improve with industrial AI.
Book an Adoption Session