Case Study: A Metal Parts Contract Manufacturer With Patok
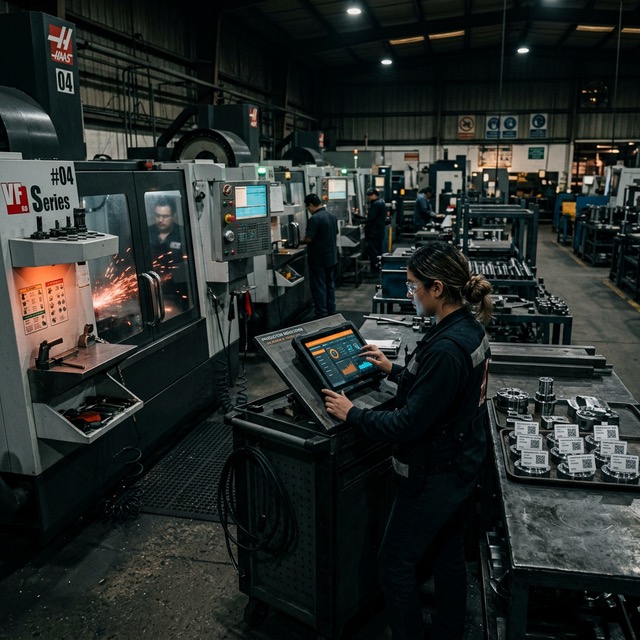
A real case study of how a precision metal parts contract manufacturer implemented Patok to achieve part-level traceability, digital OEE and shorter setup times.
Case Study: A Metal Parts Contract Manufacturer With Patok
The Plant
Type: precision metal parts contract manufacturer Operations: cutting, CNC turning, CNC milling, grinding, inspection, packing Size: 14 machines (6 CNC, 2 saws, 2 grinders, 1 welding, 3 manual stations) People: 24 operators across 2 shifts, 4 supervisors, 2 quality inspectors Customers: automotive Tier 2-3, appliance manufacturing, industrial components Volume: ~2,500 parts/day across 80+ different part numbers
The Problem: Operational Blindness
Before Patok, the operation ran on a combination of:
- Paper routing sheets that travelled with each work order
- Spreadsheets for the production schedule (updated once a day, if somebody remembered)
- WhatsApp as the "communication system" between supervisors and management
- The supervisor's memory as the main source of information ("how are we doing?" → "more or less fine")
The Symptoms
1. "We don't know where the parts are" With 80+ part numbers in process simultaneously, parts got lost between workstations. The supervisor spent 45 minutes at the start of each shift counting WIP on the floor just to know what was there and where.
2. "OEE is a mystery" Setups "took 20 minutes" according to the operators. The reality, which they discovered later with data: the average was 42 minutes, peaking at 75 minutes on complex tooling changes.
3. "Quality claims are killing us" An automotive customer rejected a batch of brackets with dimensional variation. The plant took 3 days to trace which machines had processed those parts, which operators were involved, and whether more parts were affected. The customer withheld payment for 45 days.
4. "The shifts are a black box" The night shift reported "normal production". But late deliveries were always parts processed on that shift. No data, no visibility, no accountability.
The Solution: Patok Gemba + Digital Twin
Week 1: Setup
Days 1-2: platform configuration
- The 14 machines created in the system with their positions (start, middle, end of line)
- Products defined with their standard process routings
- QR codes printed for every machine (total: $8 in laminated stickers)
Days 3-4: hardware installation
- 6 Android tablets ($1,800 total) mounted at the key stations (the 6 CNCs + inspection)
- 1 thermal printer ($350) to generate QR codes for individual parts
- 1 tablet for the supervisor as a "Gemba Walker"
Day 5: training
- 2 hours of training per shift
- Each operator learned: scan the machine QR → see the queue → take a part → start the operation → end the operation
- Total flow time for the operator: 4-6 seconds per part
Total investment: $2,150 in hardware plus the monthly Patok subscription
Week 2: Go-Live and First Data
Operators started logging operations on the morning shift. Within 48 hours, the data revealed what years of spreadsheets never had.
What They Found (and Didn't Like)
Revelation 1: The Real OEE
| Machine | "Perceived" OEE | Real OEE (week 1) | Main loss |
|---|---|---|---|
| CNC-1 (Haas) | ~75% | 58% | Setup (38 min average) |
| CNC-2 (Haas) | ~70% | 52% | Micro-stoppages (door sensor) |
| CNC-3 (Mazak) | ~80% | 67% | Material (waiting on the warehouse) |
| CNC-4 (Mazak) | ~75% | 61% | Setup (tooling changes) |
| CNC-5 (Doosan) | ~70% | 48% | Recurring mechanical failures |
| CNC-6 (Doosan) | ~65% | 45% | Inexperienced operator + micro-stoppages |
The plant's average OEE was not the 72% they believed — it was 55%. Which meant they were leaving 17 points of productivity on the table.
Revelation 2: The Phantom Bottleneck
Everyone believed the bottleneck was CNC-3 because "material always piles up there". The data showed the opposite: CNC-3 had the highest OEE. Material accumulated in front of it because the cutting saws fed faster than the average capacity of the 6 CNCs could absorb.
The real bottleneck was CNC-5, which at 48% OEE was dragging down the throughput of the whole operation. And nobody saw it because CNC-5 "was always running" — running slowly, with frequent stoppages.
Revelation 3: The Gap Between Shifts
| Metric | Morning shift | Night shift |
|---|---|---|
| Average OEE | 61% | 49% |
| Parts/shift | 1,340 | 1,080 |
| Average setup | 35 min | 52 min |
| Micro-stoppages/shift | 8 | 23 |
| Scrap | 3.2% | 6.8% |
The night shift produced 19% less with double the scrap. The main cause: an operator on CNC-5 who wasn't completing setups correctly, producing out-of-tolerance parts that piled up as scrap the next day.
The Actions They Took
Month 1: Quick Wins
1. Setup standardization (impact: -35% setup time)
Using cycle time data by setup type, they created standards for the 10 most frequent tooling changes. Each setup now has a digital checklist the operator follows on the tablet.
Result: average setup dropped from 42 min to 27 min.
2. Preventive maintenance on CNC-5 (impact: OEE from 48% to 63%)
Micro-stoppage data revealed a pattern: the tool sensor failed intermittently. A technician replaced it in 2 hours. Micro-stoppages fell from 23/shift to 4/shift.
3. Retraining the night operator (impact: scrap from 6.8% to 3.5%)
With scrap data by operator and machine, they identified one operator producing 3× more defects than average. It wasn't negligence — it was a lack of training on CNC-5's setups. Solution: one day of retraining.
Months 2-3: Systemic Improvements
Every part now has an individual QR code. The complete history (materials, operations, inspections, operators) is available in seconds. The first claim from the automotive customer after implementing Patok was resolved in 15 minutes instead of 3 days.
They installed screens at 3 critical workstations showing the shift's OEE in real time. Operators began to self-regulate: "We're at 53%, we need to catch up."
The manager now does his morning round with the Gemba Walker. He scans each machine's QR code and sees OEE, queued parts, latest incidents. In 15 minutes he has the plant's full pulse without asking anyone.
The Results After 3 Months
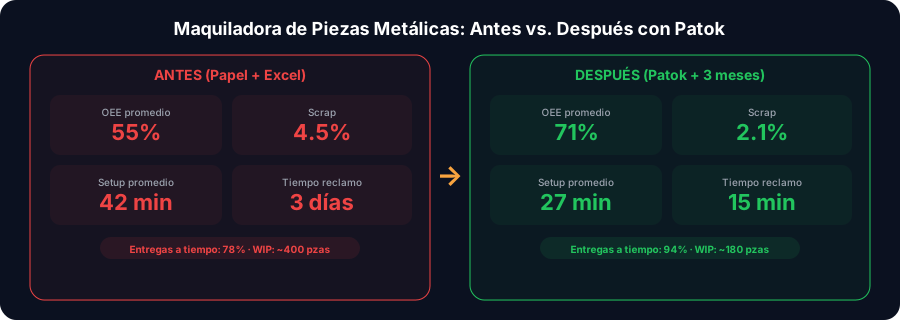
| Metric | Before | After (3 months) | Change |
|---|---|---|---|
| Average OEE | 55% | 71% | +16 points |
| Daily output | 2,500 parts | 3,100 parts | +24% |
| Scrap | 4.5% | 2.1% | -53% |
| Average setup | 42 min | 27 min | -36% |
| Claim resolution time | 3 days | 15 min | -99.7% |
| On-time delivery | 78% | 94% | +16 points |
| WIP on the floor | ~400 parts | ~180 parts | -55% |
Calculated ROI
Total investment (hardware + 3 months subscription): ~$4,000
Monthly benefit (extra output + scrap savings + admin savings): ~$38,000
Payback: < 1 week
3-month ROI: ~2,750%
For the detailed calculation methodology, read our article on the ROI of digitizing your plant.
The Patok Methodologies Used
Sprint (Primary Methodology)
Sprint is the Patok Gemba methodology built for discrete manufacturing with high product variety — exactly this contract manufacturer's scenario. Each workstation runs as a kiosk where the operator:
- Scans the machine's QR code
- Sees their work queue with priorities
- Takes a part (QR scan)
- Starts the operation
- Processes as usual
- Ends the operation
Total operator overhead: 4-6 seconds per part.
Check (Quality)
Patok's Check methodology was implemented at the inspection station. Every part arriving at inspection:
- Gets its QR code scanned
- The system shows the product's acceptance criteria
- The inspector logs the result (OK/NOK) with a photo if needed
- The part is released — or blocked — automatically
What the Manager Says Now
"I used to be the plant's information system. Everyone asked me because I was the only one who knew what was going on — and I didn't really know either. Now I open the Digital Twin on my laptop and see the whole plant in 30 seconds. My supervisors make decisions with data. And when a customer calls, I have the answer before they finish describing the problem."
Lessons Learned
What Worked Better Than Expected
- Operator adoption: within 3 days, 90% of operators were scanning without help. The interface is easier than WhatsApp.
- The impact of visible OEE: putting OEE on screen changed operator behavior more than any financial incentive.
- Traceability as a sales tool: the commercial team started using traceability as a sales argument: "Our parts come with a complete digital history."
What They Would Do Differently
- Start with fewer machines: in hindsight it would have been better to start with the 6 CNCs only and add the other stations after two weeks.
- Involve the night shift from day 1: the night shift started capturing data a week after the morning shift, which produced a week of incomplete data.
Does Your Plant Look Like This?
If you run a contract manufacturer or discrete manufacturing shop with these characteristics:
- 5-30 machines (CNC, conventional, manual stations)
- High variety of part numbers
- An operation running on paper and spreadsheets
- No visibility of real OEE
- Quality claims that take days to investigate
…then the results in this case study are reproducible in your plant. It isn't magic — it is visibility. And with the right visibility, the improvement actions become obvious.
To start your own digitization path, follow our guide on how to digitize your plant in 5 steps.
Want to see similar results in your plant? Book a free diagnostic Gemba Walk — we walk your floor, identify your main opportunities, and show you what your operation would look like with digital visibility.
Topics
Related Articles
More on ROI & Use Cases

Ready to transform your plant?
Book a free adoption session and find your biggest opportunity to improve with industrial AI.
Book an Adoption Session