Mieruka: Digital Visual Management for Your Plant
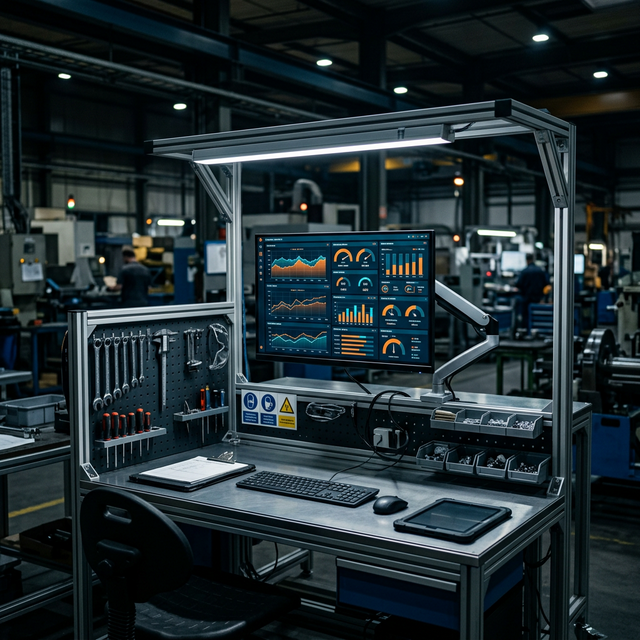
Learn what Mieruka (見える化) is, how visual management works in manufacturing, and why the digital version far outperforms physical boards.
Mieruka: Digital Visual Management for Your Plant
Mieruka (見える化) is the Japanese word that literally means "to make visible". In Lean manufacturing, it is the practice of making the state of the process understandable at a glance, without having to ask, dig for data, or open a piece of software.
The idea is powerful in its simplicity: if you can see a problem, you can solve it. If you can't see it, it doesn't exist for you.
Mieruka at Toyota: The Origin
Toyota developed Mieruka as an integral part of the Toyota Production System. The premise:
"A visible problem is a problem half solved."
In Toyota's plants, everything is designed to communicate state:
- Andon lights that change color with the state of the line
- Production boards next to each workstation showing target vs actual
- Lines painted on the floor marking out material zones, aisles and WIP areas
- Level markers on material containers showing when to replenish
The goal: anyone — operator, supervisor, director or visitor — can understand what is happening in the plant after 30 seconds of looking.
The 4 Levels of Mieruka
Level 1: Identification
The most basic. Signs saying where everything is: machine name, material zone, emergency exit. Surprisingly, many plants in Latin America don't even have this.
Level 2: Current State
Boards showing the state right now: is the machine running? How many parts have we made? Are we on time or behind?
Level 3: Trend
Charts showing whether we are improving or getting worse over time: weekly OEE, defects per shift, setup times.
Level 4: Prediction and Action
The most advanced level: indicators that don't just show the past but warn about the future. "At this rate, we're not going to make Friday's order" is Level 4 Mieruka.
The Problem With Physical Mieruka Boards
Let's be honest: physical Mieruka boards have serious problems in the reality of a plant:
1. Nobody updates them. Writing on a whiteboard by hand every hour takes discipline that fades after two weeks. The board keeps showing yesterday's data — or last week's.
2. Only the people standing there see them. The manager in the office doesn't see the board. The director in another city, even less. The information is local.
3. They don't calculate anything. A physical board can show parts produced, but it cannot compute OEE, cannot compare cycle time vs takt time, cannot detect bottlenecks.
4. They have no memory. At the end of the shift they get wiped. No history, no trends, nothing to compare.
Digital Mieruka: Visual Management With Real Data
Digital Mieruka takes the original principles and strengthens them with automatic data, real time, and universal access.
How It Works With Patok
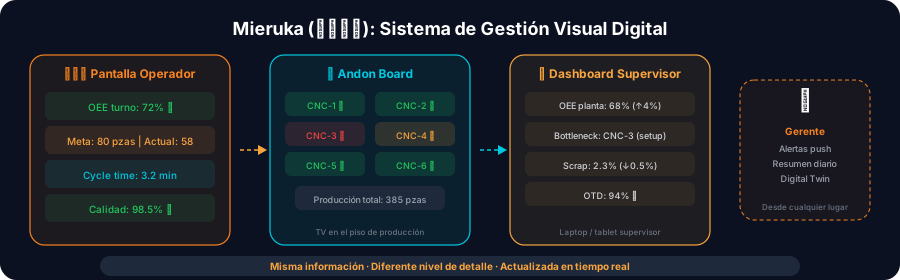
Patok implements digital Mieruka at three levels:
At the workstation (for the operator)
Each machine or workstation can have a tablet or screen showing:
- A progress bar: shift target vs current output (green if on track, yellow if slipping, red if critical)
- Partial OEE: Availability × Performance × Quality for the current shift
- Active state: an icon showing whether it is running, in setup, stopped or under maintenance
- Work queue: how many parts are waiting and which order is next
The operator understands their situation in 3 seconds, without asking anyone.
On the floor (for the supervisor)
The operator menu gives the supervisor a view of all their workstations: which are green, which yellow, which red. It is the digital equivalent of taking in the whole line at a glance — with data a glance could never see.
In the office (for management)
The Digital Twin shows the complete plant with the state of every machine. Alerts arrive as push notifications. Management gets Mieruka without walking — complemented by periodic Gemba Walks to stay connected to the floor.
Implementing Digital Mieruka: 3 Steps
Step 1: Decide What Needs to Be Visible
Don't put everything on screen. Pick the 3-5 metrics that matter most for each role:
- Operator: target, current output, machine state
- Supervisor: OEE per workstation, active alerts, queued WIP
- Manager: OEE per line, orders at risk, bottlenecks
Step 2: Install the Display Points
- An Android tablet in an industrial mount at each workstation (~$250)
- A large screen in the supervisor's area for the consolidated view
- The web app in the manager's browser
Step 3: Configure the Alerts
Mieruka isn't only visual — it is proactive. Set thresholds:
- OEE below 65% → notify the supervisor
- Machine stopped for more than 15 min → escalate to the manager
- Output more than 10% behind target → alert the planner
Mieruka and 5S: The Connection
Mieruka is the natural evolution of 5S. 5S creates physical order; Mieruka makes operational performance visible. Without 5S, the floor is chaos and Mieruka cannot work. Without Mieruka, 5S is tidiness with no productive purpose.
The ideal combination:
- 5S so every workstation is organized, clean and standardized
- Digital Mieruka so every workstation shows its performance in real time
Conclusion
Mieruka is the Lean practice that gains most from digitization. The original concept — make it visible — was always limited by the medium: boards nobody updates. With screens, automatic data and intelligent alerts, Mieruka finally delivers on its promise: anyone can understand the state of the plant at a glance.
And that — visibility — is where all improvement begins.
To see how Mieruka fits together with Gemba Walk, Andon, Kanban and the rest of the Lean toolkit, read our Guide to Lean Manufacturing in the Digital Era.
Does your plant have boards nobody updates? Explore Patok Gemba and transform your visual management with real-time data.
Topics
Related Articles
More on Lean Manufacturing
Ready to transform your plant?
Book a free adoption session and find your biggest opportunity to improve with industrial AI.
Book an Adoption Session