OEE & Metrics.
No sensors.
Automatic OEE calculated from your operators' actions — not from expensive IoT sensors. Availability, performance, and quality broken down by machine, shift, operator, and work order.

The 3 dimensions of OEE
Availability × Performance × Quality = OEE. Patok calculates each one automatically from the operator's QR actions.
Availability
Calculated automatically from productive time vs. downtime. Every QR pause/resume is captured as an event.
Performance
Parts produced vs. theoretical capacity. Based on real cycle times — not on engineering estimates.
Quality
Accepted vs. rejected parts. QC checks and rejection events feed this indicator in real time.
Metrics that change decisions
We do not just show numbers — we show why it happened and what you can improve.
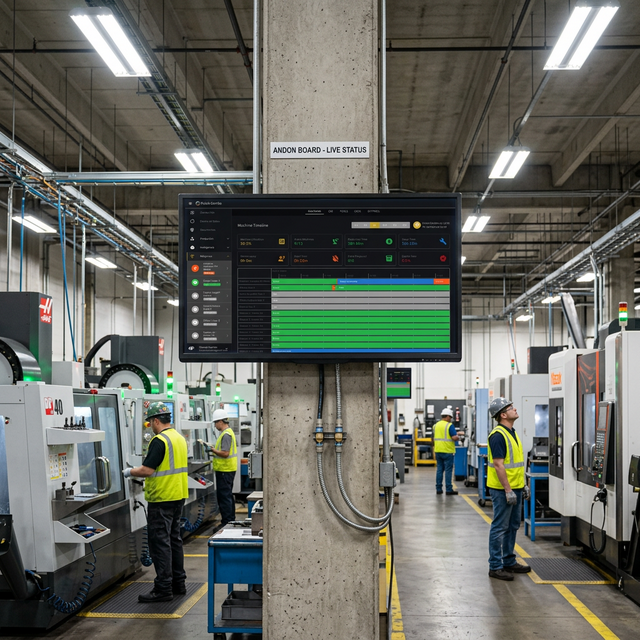
A live dashboard per machine
Every machine has its own HUD card in the Digital Twin with real-time OEE, average cycle time, parts produced, and current state. The plant manager sees it all from their laptop.
- Real-time OEE with sparklines
- Automatic detection of stoppages and downtime
- Comparison by shift, operator, and work order
Identify bottlenecks
Automatic Pareto analysis of downtime reasons, machines with the most downtime, and the most productive operators. All from real data, not manual reports.
- Pareto of downtime reasons by machine
- Machine ranking by availability
- Yield by product and work order
Automatic OEE.
From day one.
No sensors, no wiring, no IT project. Just QR Actions and a tablet.